What is a science fair project and what do I need to complete my science fair project?
**Remember: There is a difference between a science "model", a science "experiment", and an engineering project. A model is a mini version of a science concept (like the solar system, parts of a flower, hover craft, making slime, creating examples of rocks, etc.) Models can be fun but they are NOT experiments. An experiment has a test variable, outcome variable, and constants. An engineering projects needs to solve a problem and have a prototype that is tested and readjusted to come up with the best solution (see rubric).
Students can create an EXPERIMENT, a MODEL, or ENGINEERING PROJECT. This page describes the science EXPERIMENT process. If you want to create a model or an engineering project, you may!
Does this cost me any money?
This depends on the project you and your child select. Many science experiments do not require the purchasing of extra materials. Many experiments can be done with common household or classroom items. Students must present their information on a project display board (trifold). To be competitive (be selected as a winner), students must have a presentation board (trifold) to display their information. For noncompetitive projects, the big trifold is not required; students can display their information on mini folders instead (see class example).
Does my child have to complete and present a science fair project?
Yes, it is a requirement for 4th and 5th grade students to complete individual science fair projects. If you need more assistance, please email me at [email protected]
Can I help my child with their science fair project?
Yes, absolutely! However, you can not complete the project FOR your child. They must be able to use their presentation board (trifold) to present their question, prediction, variables, conclusion, etc. to the class. We have been doing experiments all year so this is their time to shine!
How will the science fair project be graded/judged?
We will use a rubric to grade either the science experiment or the engineering project. Please see below as to how each one is graded:
SCIENCE EXPERIEMENT RUBRIC:
For each item circle 0, 1, or 2:
0=No
1= Some Evidence
2= Yes
1. Is a purpose identified? (What is the reason you did this experiment?) 0 1 2
2. Has an expected outcome been identified? (What is your prediction?) 0 1 2
3. Is there research to support the expected outcome? (What research did you use to come up with your idea?) 0 1 2
4. Are the procedures described in sufficient detail to allow easy replication by another person? (Explain your procedures so we could replicate your experiment.)0 1 2
5. Is there evidence that a well-planned investigation was conducted? (What materials did you use? How long did it take you to collect data? Did you complete at least 3 trials? What was your test variable? What was your outcome variable? What was your conclusion? What results would you like to report to us?)0 1 2
6. Was appropriate empirical data collected? (What observations did you make to collect your data? What were you measuring?)0 1 2
7. Are the data displayed in an easy-to-read graph and/or table? (Is your science display board easy to understand and read by someone other than you - the author?)0 1 2
8. Are the data analyzed to seek an answer to the question, evaluate the hypothesis, or meet the engineering goal? (What are the results of your experiment? What did you find? Was your prediction supported or not supported or not conclusive?)0 1 2
9. Is the project presented in a manner that makes the purpose, procedure, and results clear?0 1 2
10. Was a log maintained that includes qualitative and/or quantitative observations?0 1 2
TOTAL POINTS (add points together): _______
Engineering Project Grading Rubric:
0=No
1= Some Evidence
2= Yes
1. QUESTION: Defined the Problem (analyze the problem and fully describe the problem in your own words).
2. BRAINSTORM: Identified the project criteria and constraints.
3. BRAINSTORM: Discussed numerous ideas, responses, or solutions to problem.
4. BRAINSTORM: Conducted relevant research on scientific principles and topics related to the project criteria and constraints.
5. BRAINSTORM: Sketches are clear, unique, and/or unusual ideas.
6. PLAN & DESIGN: Justified the chosen design based on the project criteria and constraints (must have more than one design, showing how they adjusted it to be better each time).
7. BUILD & CREATE: Show your plan or diagrams on how you built your prototype.
8. TEST & ANALYZE: Explained how he/she analyzed the data from tests to determine the best characteristics or solution for the final prototype (how did you change your prototype each time to get better).
9. REFLECT & IMPROVE: Self- assess the prototype and analyze all design flaws or problems.
10. Explain how your chosen prototype has solved the problem or impacted the community/natural environment.
TOTAL POINTS (add points together): _______
Science Fair:
0-9 Falls far below inquiry standards
10-14 Approaches inquiry standards
15-19 Meets inquiry standards (Honorable Mention)
20 Exceeds inquiry standards (Exemplary Inquiry)
Grading Scale:
10/20=50%F
12/20=60%D
14/20=70%C
16/20=80%B
18/20=90% A
20/20=100% A+
How do I display my data table and my graph?
The data table should display the data collected during all 3 trials to show the test variable and the outcome variable. Likewise, the graph displays the relationship between the test variable and outcome variable, using the averages.
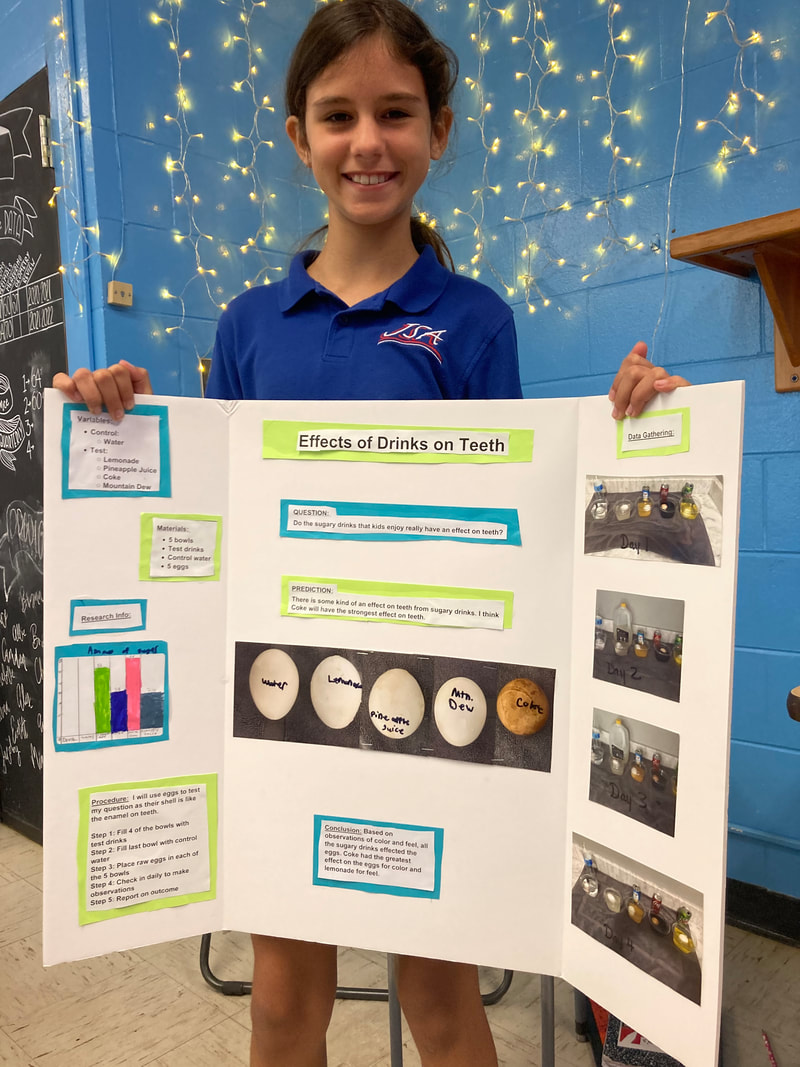
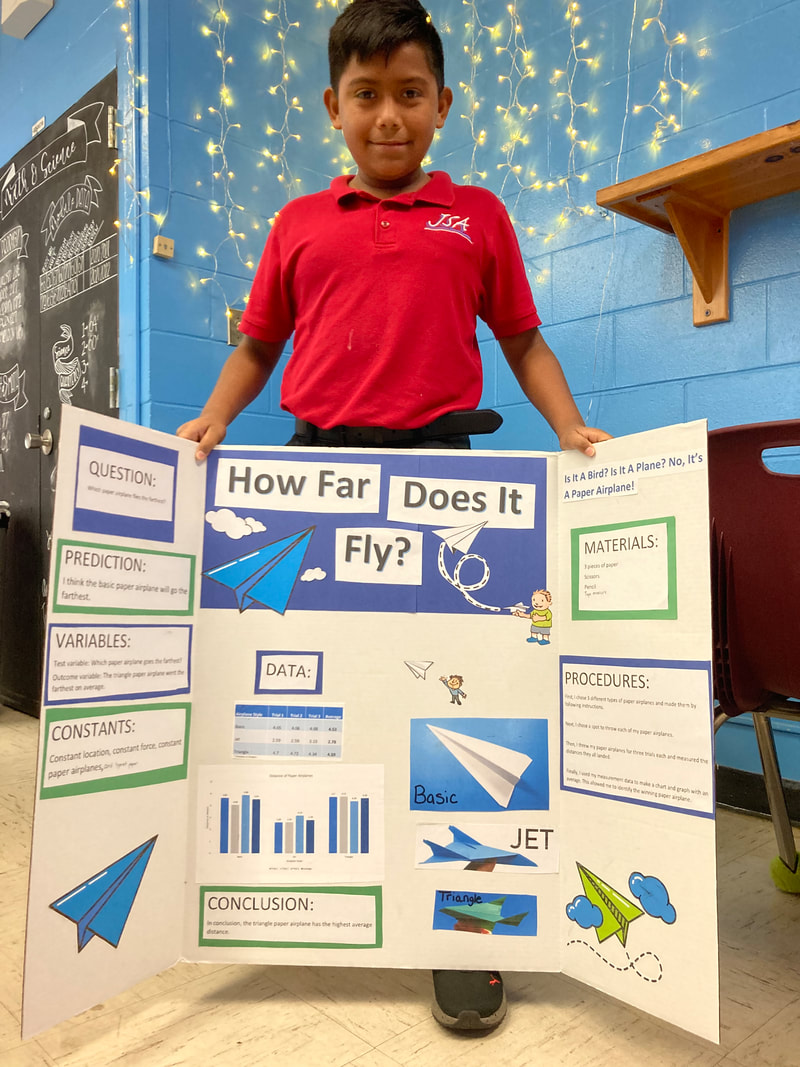
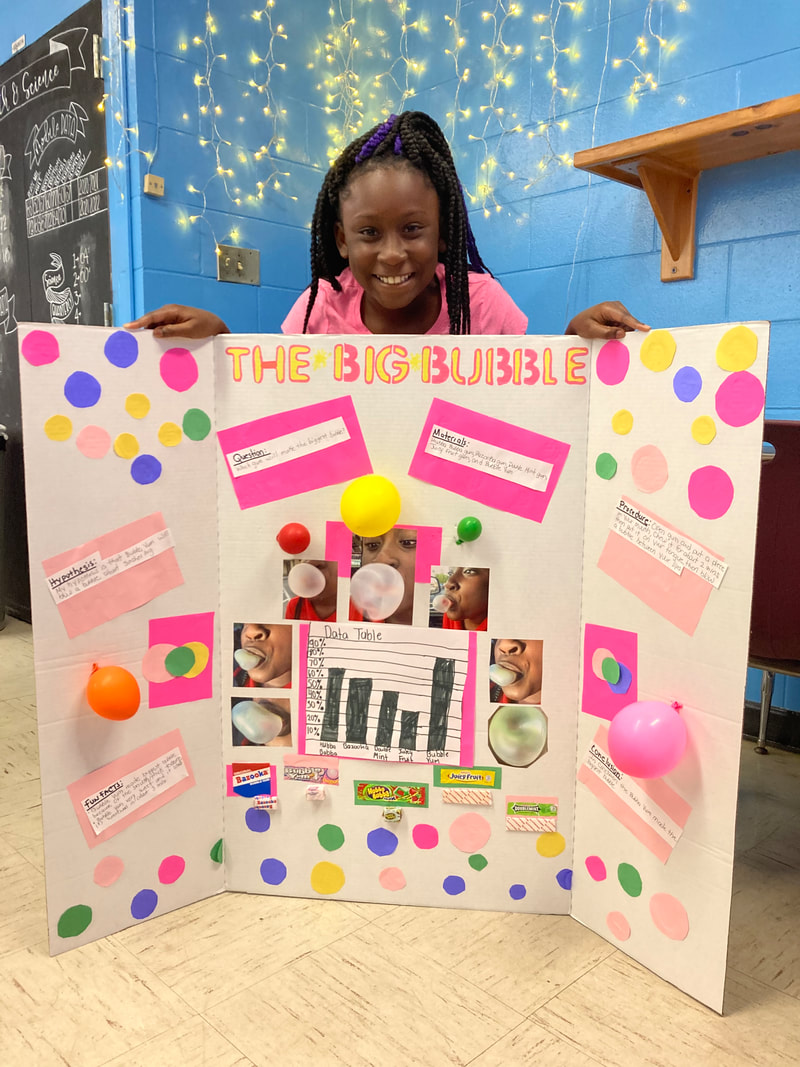
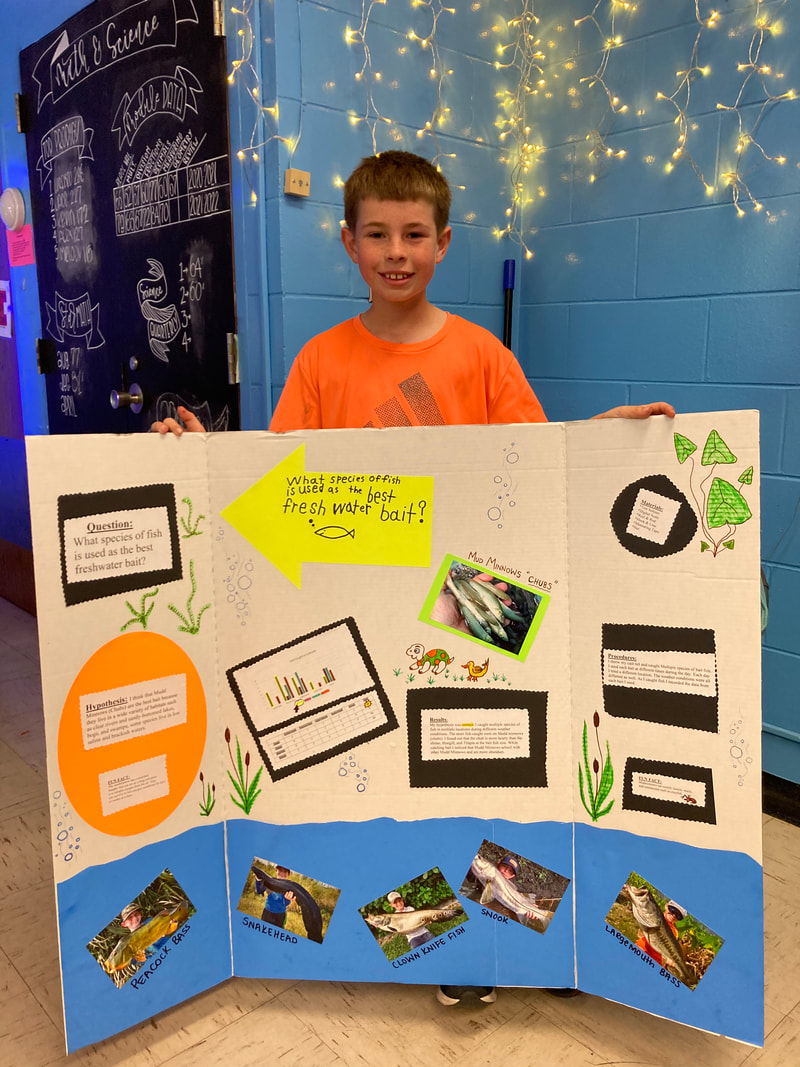
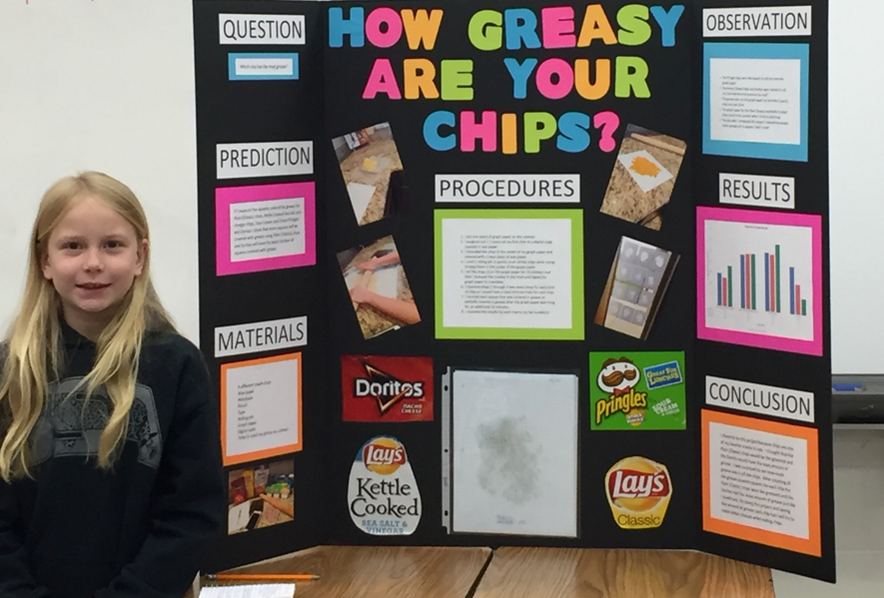
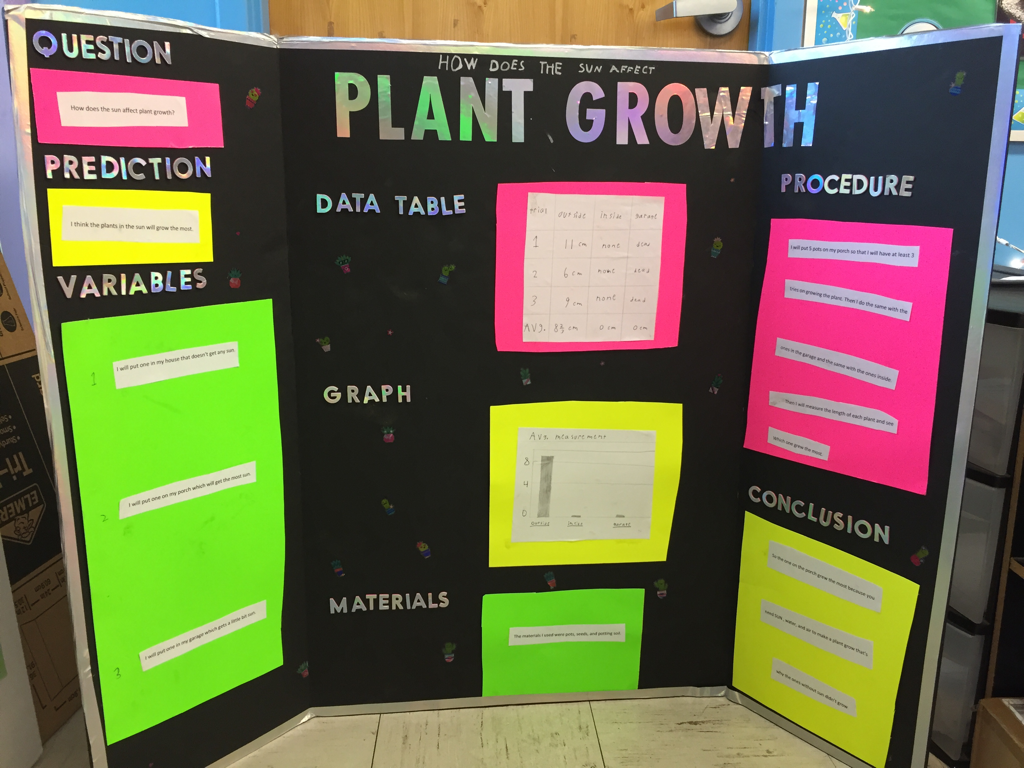
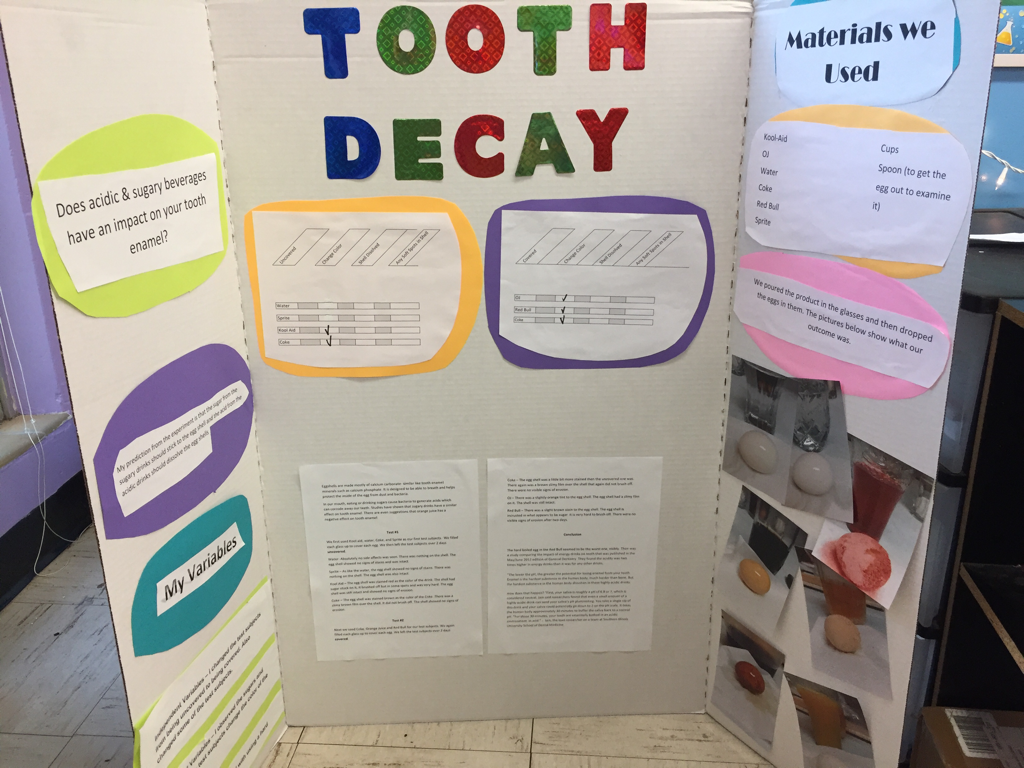
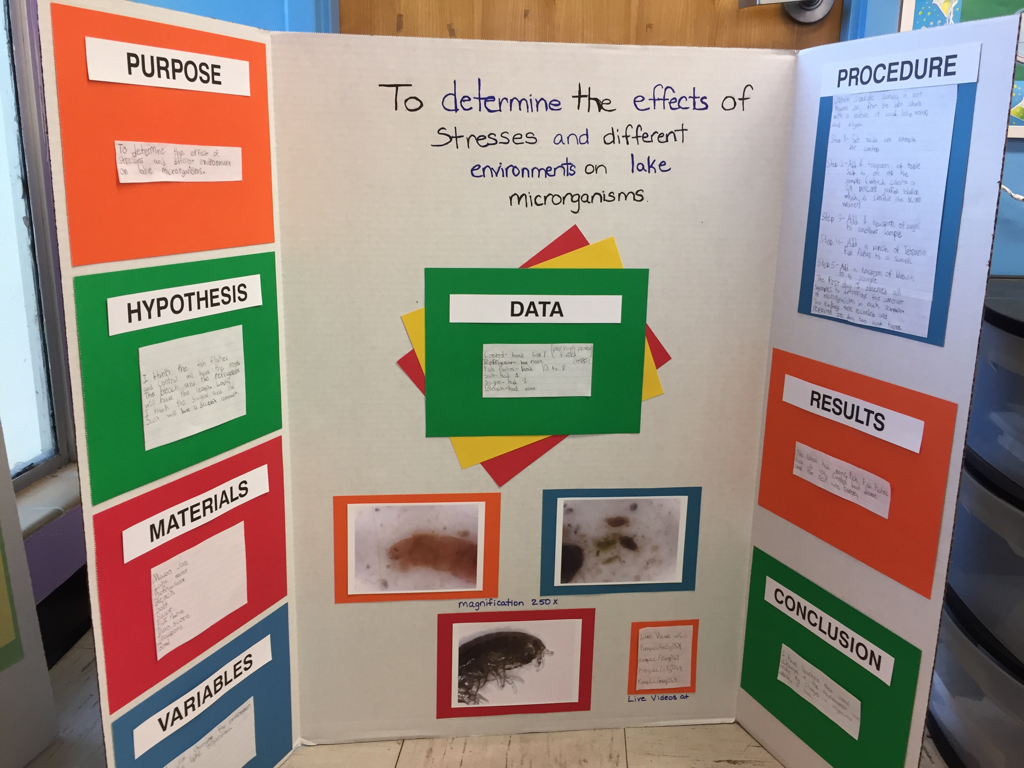
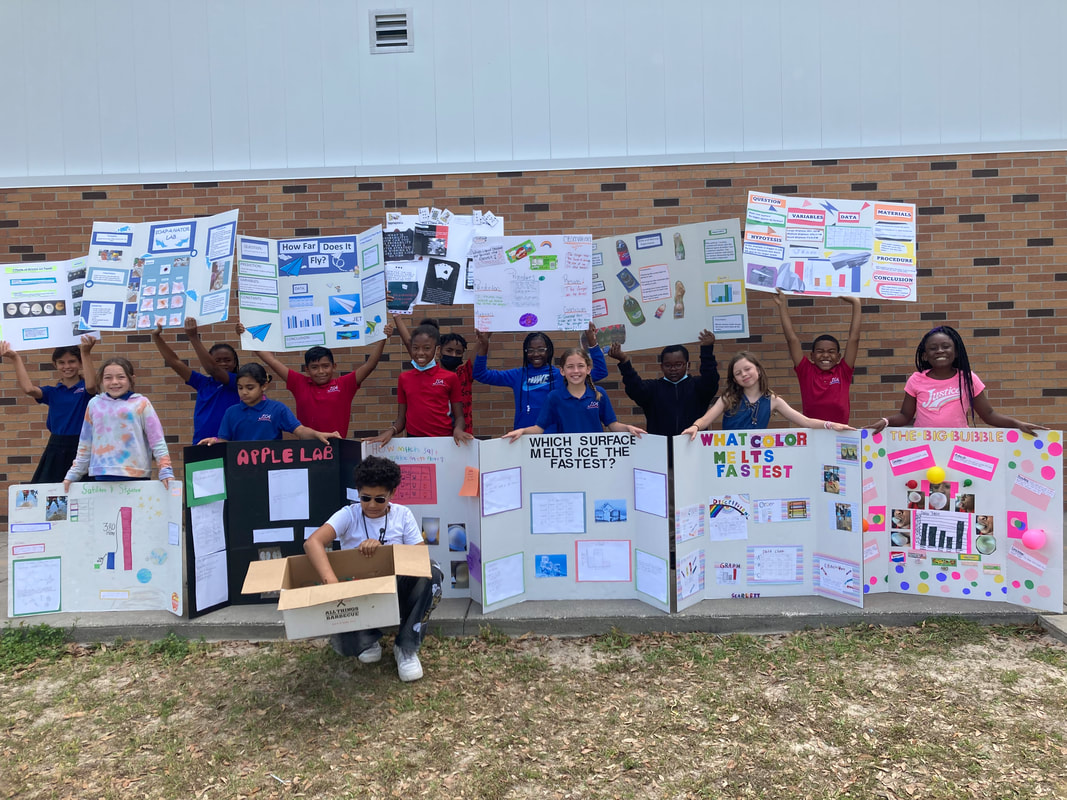
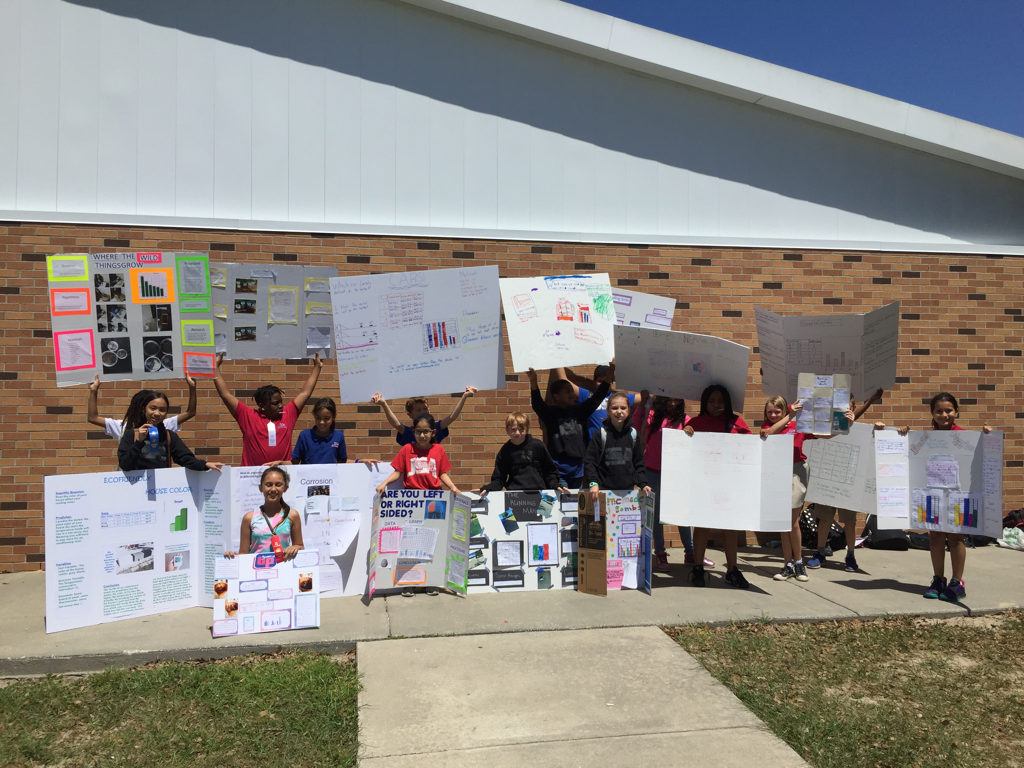
LAST STEP: How do I create the presentation board (trifold) to display my science fair information? See image below
- IDEA- what do you want your science fair project to be about? What interests do you have? Please google and/ or check this website for ideas
- PROJECT LOG- Every day you will write down what you did and what you observed about your project (date and quick summary)
- RESEARCH- Tell 3 things you did to get information about your project (talked to a scientist, online search, read a book, used your PSELL or STEMSCOPES book, etc.)
- QUESTION- What is the purpose of your project? What will you be trying to find evidence for?
- PREDICTION- What do you think will be the answer to your question?
- MATERIALS- What materials will you need to do your project? Do you have them all? How can you get your supplies?
- VARIABLES- What is your test variable (thing you are testing), outcome variable (thing that changes/is measured), constants (things that stay the same throughout the experiment), and control group (optional)?
- PROCEDURES- What procedures will you follow to test your question?
- CONDUCT THE EXPERIMENT & COLLECT DATA- Follow your procedures, collect your data on a chart/table, graph your data
- CONCLUSION- What was the outcome of your experiment?
- COMMUNICATE YOUR RESULTS- **Present your project and findings in front of the class** (see the trifold example)
**Remember: There is a difference between a science "model", a science "experiment", and an engineering project. A model is a mini version of a science concept (like the solar system, parts of a flower, hover craft, making slime, creating examples of rocks, etc.) Models can be fun but they are NOT experiments. An experiment has a test variable, outcome variable, and constants. An engineering projects needs to solve a problem and have a prototype that is tested and readjusted to come up with the best solution (see rubric).
Students can create an EXPERIMENT, a MODEL, or ENGINEERING PROJECT. This page describes the science EXPERIMENT process. If you want to create a model or an engineering project, you may!
Does this cost me any money?
This depends on the project you and your child select. Many science experiments do not require the purchasing of extra materials. Many experiments can be done with common household or classroom items. Students must present their information on a project display board (trifold). To be competitive (be selected as a winner), students must have a presentation board (trifold) to display their information. For noncompetitive projects, the big trifold is not required; students can display their information on mini folders instead (see class example).
Does my child have to complete and present a science fair project?
Yes, it is a requirement for 4th and 5th grade students to complete individual science fair projects. If you need more assistance, please email me at [email protected]
Can I help my child with their science fair project?
Yes, absolutely! However, you can not complete the project FOR your child. They must be able to use their presentation board (trifold) to present their question, prediction, variables, conclusion, etc. to the class. We have been doing experiments all year so this is their time to shine!
How will the science fair project be graded/judged?
We will use a rubric to grade either the science experiment or the engineering project. Please see below as to how each one is graded:
SCIENCE EXPERIEMENT RUBRIC:
For each item circle 0, 1, or 2:
0=No
1= Some Evidence
2= Yes
1. Is a purpose identified? (What is the reason you did this experiment?) 0 1 2
2. Has an expected outcome been identified? (What is your prediction?) 0 1 2
3. Is there research to support the expected outcome? (What research did you use to come up with your idea?) 0 1 2
4. Are the procedures described in sufficient detail to allow easy replication by another person? (Explain your procedures so we could replicate your experiment.)0 1 2
5. Is there evidence that a well-planned investigation was conducted? (What materials did you use? How long did it take you to collect data? Did you complete at least 3 trials? What was your test variable? What was your outcome variable? What was your conclusion? What results would you like to report to us?)0 1 2
6. Was appropriate empirical data collected? (What observations did you make to collect your data? What were you measuring?)0 1 2
7. Are the data displayed in an easy-to-read graph and/or table? (Is your science display board easy to understand and read by someone other than you - the author?)0 1 2
8. Are the data analyzed to seek an answer to the question, evaluate the hypothesis, or meet the engineering goal? (What are the results of your experiment? What did you find? Was your prediction supported or not supported or not conclusive?)0 1 2
9. Is the project presented in a manner that makes the purpose, procedure, and results clear?0 1 2
10. Was a log maintained that includes qualitative and/or quantitative observations?0 1 2
TOTAL POINTS (add points together): _______
Engineering Project Grading Rubric:
0=No
1= Some Evidence
2= Yes
1. QUESTION: Defined the Problem (analyze the problem and fully describe the problem in your own words).
2. BRAINSTORM: Identified the project criteria and constraints.
3. BRAINSTORM: Discussed numerous ideas, responses, or solutions to problem.
4. BRAINSTORM: Conducted relevant research on scientific principles and topics related to the project criteria and constraints.
5. BRAINSTORM: Sketches are clear, unique, and/or unusual ideas.
6. PLAN & DESIGN: Justified the chosen design based on the project criteria and constraints (must have more than one design, showing how they adjusted it to be better each time).
7. BUILD & CREATE: Show your plan or diagrams on how you built your prototype.
8. TEST & ANALYZE: Explained how he/she analyzed the data from tests to determine the best characteristics or solution for the final prototype (how did you change your prototype each time to get better).
9. REFLECT & IMPROVE: Self- assess the prototype and analyze all design flaws or problems.
10. Explain how your chosen prototype has solved the problem or impacted the community/natural environment.
TOTAL POINTS (add points together): _______
Science Fair:
0-9 Falls far below inquiry standards
10-14 Approaches inquiry standards
15-19 Meets inquiry standards (Honorable Mention)
20 Exceeds inquiry standards (Exemplary Inquiry)
Grading Scale:
10/20=50%F
12/20=60%D
14/20=70%C
16/20=80%B
18/20=90% A
20/20=100% A+
How do I display my data table and my graph?
The data table should display the data collected during all 3 trials to show the test variable and the outcome variable. Likewise, the graph displays the relationship between the test variable and outcome variable, using the averages.
LAST STEP: How do I create the presentation board (trifold) to display my science fair information? See image below
- DO attach headings to easily identify each portion of the project
- DON’T put anything 3-dimentional on the presentation board
- DO attach photos of the experiment if they aid understanding of the project
- DON’T attach photos of children’s faces
- DO have the log book available
- DON’T include any part of the project apparatus
- DO label the back of the project with the name of the child’s school and grade level
- DON’T include the child’s name on the project


Below are some examples of
Engineering Projects:
Engineering Projects:
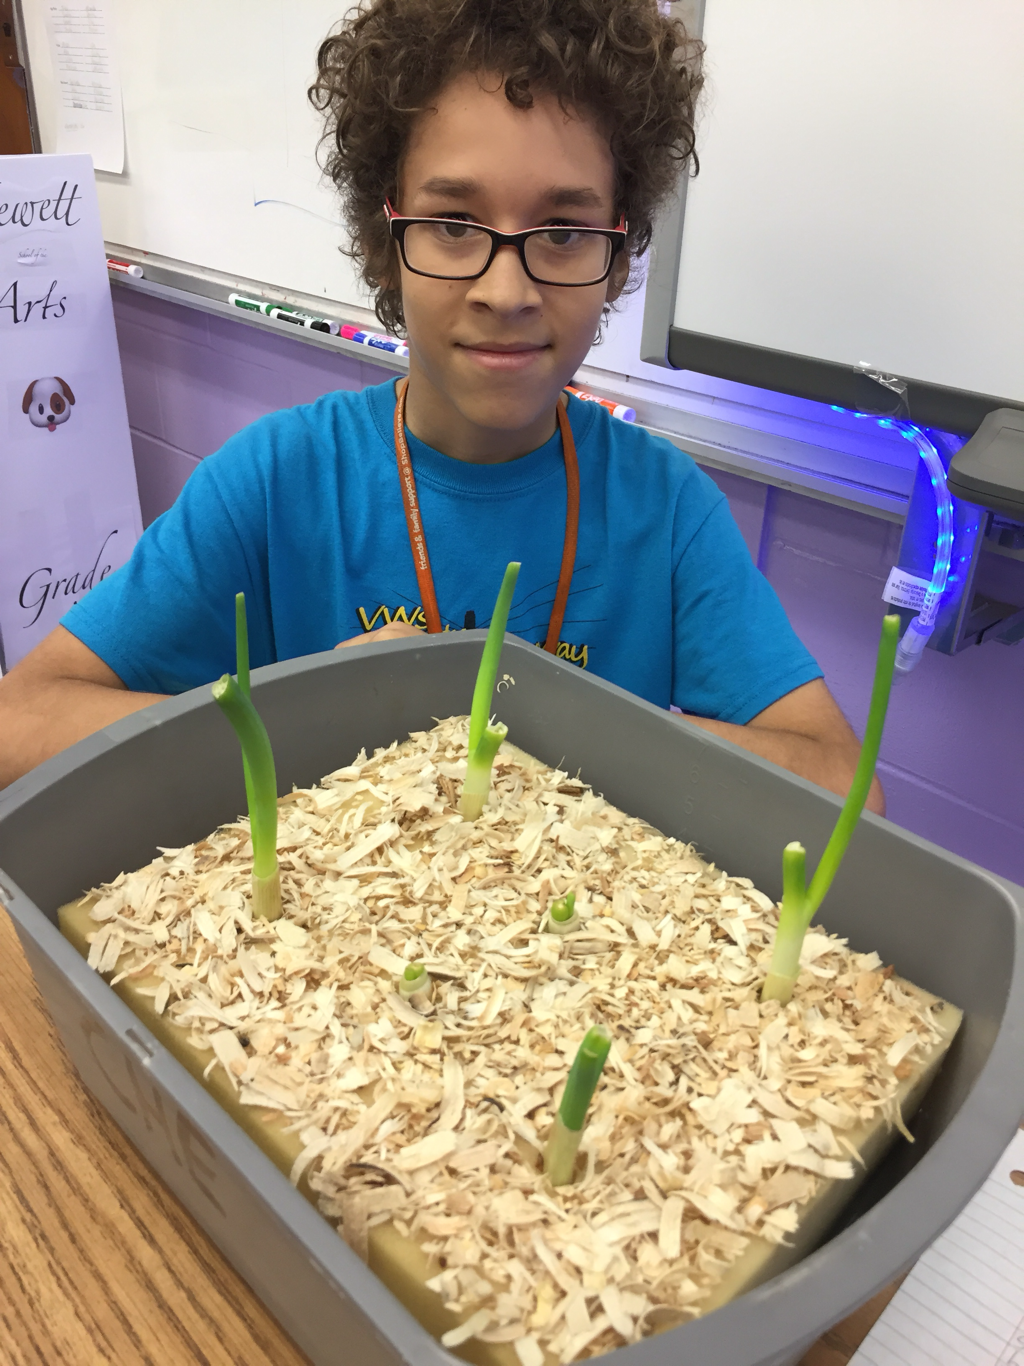
Hydroponic Garden
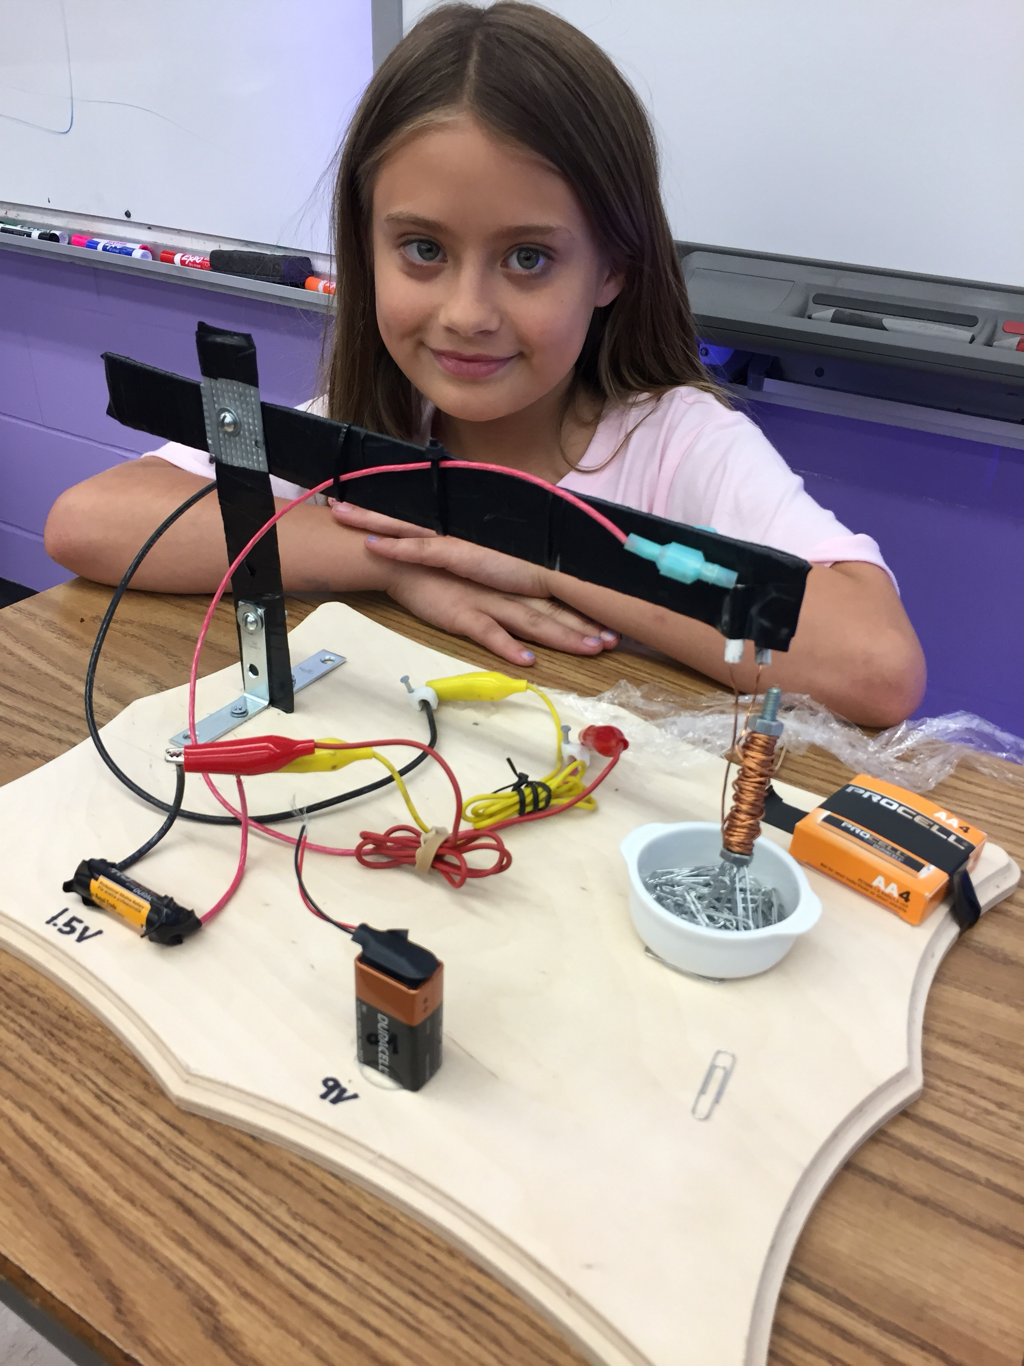
Electromagnet:
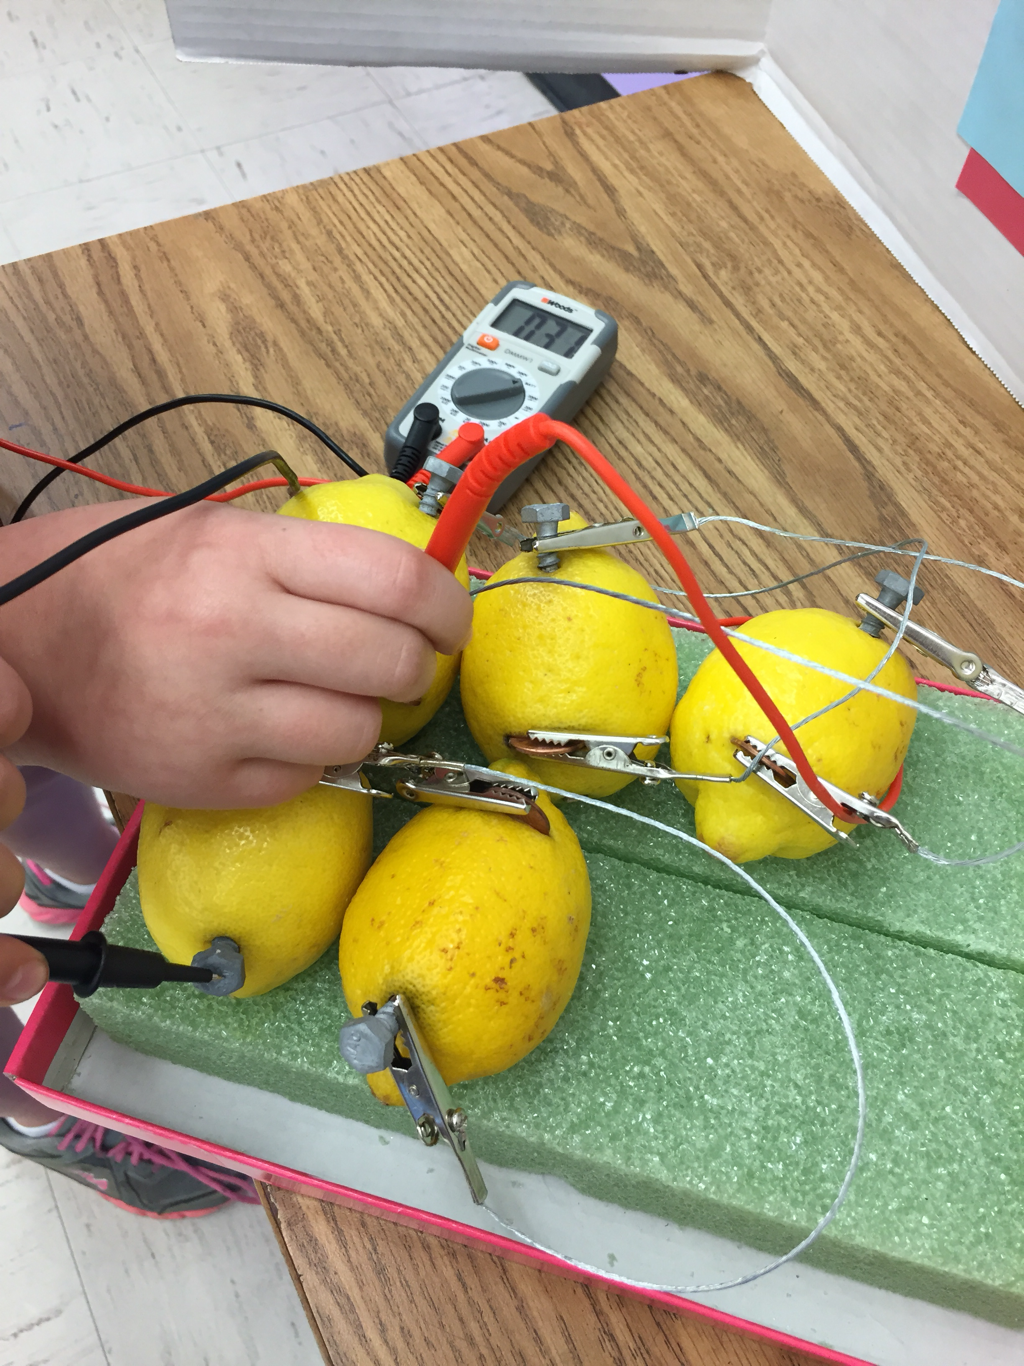
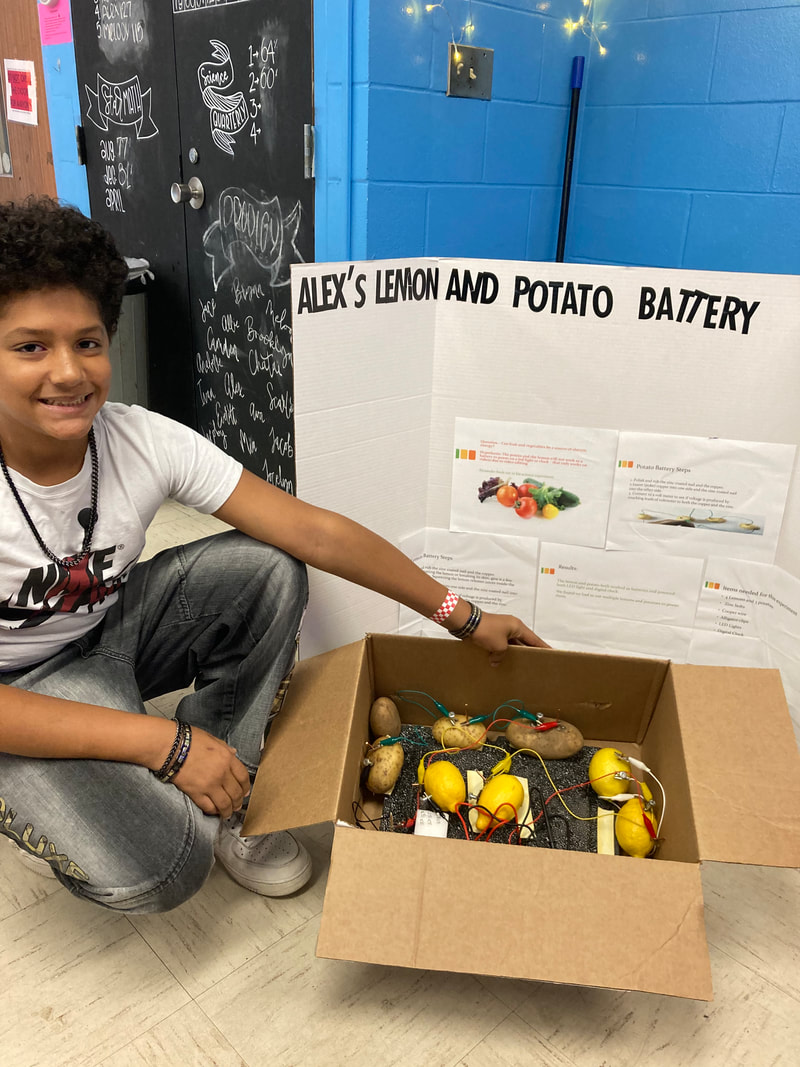
Lemon Battery